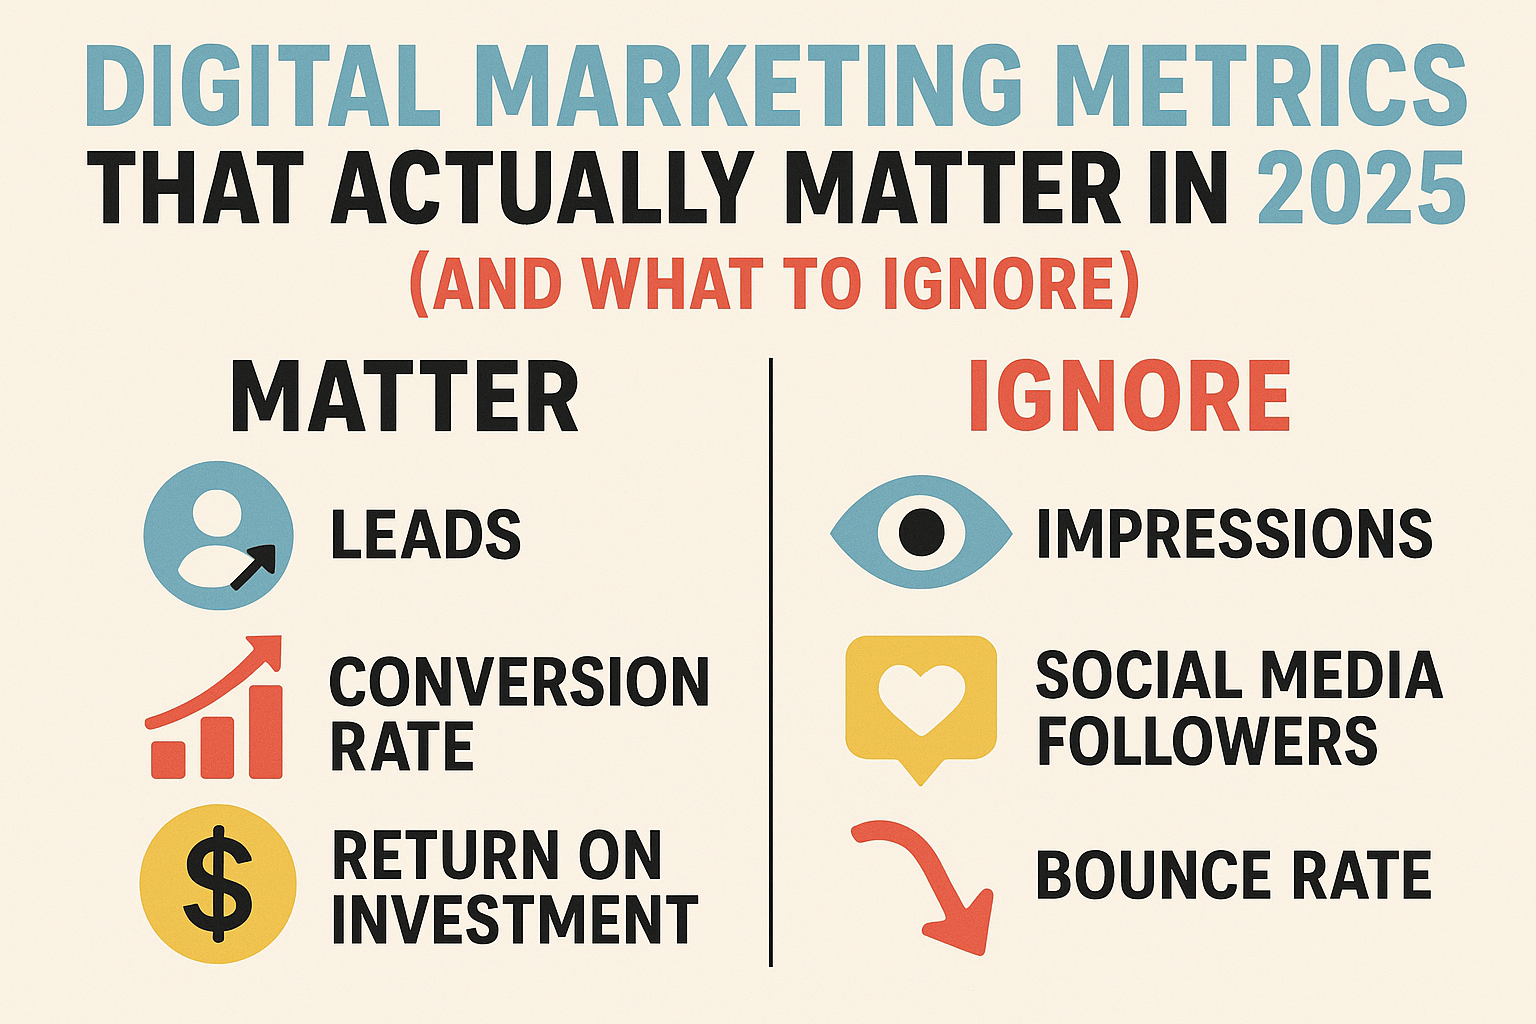
As we move through 2025, the landscape has shifted. Privacy regulations, the demise of third-party cookies, and the rise of AI-powered analytics have fundamentally changed how we measure success. The old vanity metrics that once adorned quarterly reports are now dangerously obsolete. Today, the winning brands are those that focus on a tighter, more impactful set of key performance indicators (KPIs) that directly tie to revenue and sustainable growth.
This comprehensive guide will cut through the clutter. We will explore the digital marketing metrics that truly matter in 2025, backed by data and real-world examples. More importantly, we will identify the misleading metrics you should ignore to refocus your strategy, optimize your budget, and prove marketing’s undeniable value to your organization.
Why Your Metrics Strategy Needs a 2025 Update
The way we collect and use data has undergone a seismic transformation. Several key trends are driving the evolution of marketing measurement:
- The Privacy-First Web: With Apple’s App Tracking Transparency (ATT) framework, Google’s phased retirement of third-party cookies, and stringent global regulations like GDPR and CCPA, tracking individual users across the web is increasingly difficult. Metrics reliant on cross-site tracking are becoming less reliable.
- The Rise of AI and Predictive Analytics: Artificial intelligence is no longer a futuristic concept; it’s integrated into the most powerful marketing platforms. AI can process vast datasets to predict future outcomes, shifting the focus from backward-looking “lagging” indicators to forward-thinking “leading” indicators.
- Economic Pressures and The Demand for ROI: In an uncertain economic climate, every marketing dollar must be justified. C-suites are demanding clear, unequivocal proof of marketing’s contribution to the bottom line. Fluffy metrics no longer suffice.
- The Blending of Marketing and Customer Experience (CX): Marketing doesn’t end at the acquisition stage. Metrics now must encompass the entire customer journey, from first touchpoint to loyal advocacy, reflecting marketing’s role in retention and growth.
These forces require a more sophisticated, nuanced approach to measurement—one that values quality over quantity and business outcomes over superficial engagement.
The Metrics That Actually Matter in 2025: The Essential Framework
Forget tracking everything. Focus on this framework of interconnected metrics that tell the story of your marketing effectiveness from top-funnel awareness to bottom-funnel profitability.
1. Customer Lifetime Value (CLV or LTV)
What it is: The total predicted revenue a customer will generate throughout their entire relationship with your business.
Why it matters in 2025: CLV is the north star metric. In an era where acquiring new customers is more expensive than ever, understanding the long-term value of a customer is paramount. It dictates how much you should invest in acquisition (CAC), identifies your most valuable customer segments, and aligns marketing, sales, and product teams around a common goal: customer success and retention.
How to calculate it: (Average Order Value) x (Number of Repeat Purchases) x (Average Retention Time). Advanced models use predictive analytics to forecast future value based on behavioral data.
2025 Insight: AI tools can now predict CLV with remarkable accuracy, allowing marketers to proactively tailor strategies for high-value segments before they even make a second purchase.
2. Customer Acquisition Cost (CAC)
What it is: The total cost of sales and marketing efforts required to acquire a new customer.
Why it matters in 2025: CAC cannot be viewed in isolation. Its true power is revealed in its ratio to CLV. A healthy business model requires that a customer’s value (CLV) is significantly higher than the cost to acquire them (CAC). A rising CAC is a major red flag, indicating your marketing channels are becoming less efficient or more competitive.
How to calculate it: (Total Marketing & Sales Spend) / (Number of New Customers Acquired).
3. CLV:CAC Ratio
What it is: The direct comparison of Customer Lifetime Value to Customer Acquisition Cost.
Why it matters in 2025: This is arguably the most important financial metric for any growth-oriented company. A ratio of 3:1 is generally considered healthy, indicating that a customer is worth three times what it cost to acquire them. A lower ratio suggests inefficient marketing, while a much higher ratio might mean you’re under-investing in growth.
4. Marketing Originated Customer Percentage
What it is: The percentage of total new customers who interacted with a marketing touchpoint before their first purchase.
Why it matters in 2025: This metric proves marketing’s direct contribution to the sales pipeline. It helps quantify brand awareness and top-funnel efforts that are often difficult to attribute. A high percentage shows that marketing is a powerful engine for lead generation.
5. Marketing Influenced Customer Percentage
What it is: The percentage of total new customers who interacted with marketing at any point in their journey, even if the final touch was a sales call or direct visit.
Why it matters in 2025: In a complex, multi-touch buyer’s journey, this metric captures marketing’s broader impact. It acknowledges that marketing nurtures leads throughout the funnel, making it essential for accurate attribution in a cookie-less world.
6. Conversion Rate by Experience (CRbE)
What it is: A move beyond tracking a single overall website conversion rate. CRbE involves measuring conversion rates for specific, high-intent user actions that indicate progress toward a goal (e.g., “converted on a key landing page,” “watched a product demo video,” “downloaded a whitepaper”).
Why it matters in 2025: This metric provides a more granular view of content and page performance. It helps identify friction points in the journey and highlights which experiences are most effective at moving users to the next stage, allowing for precise optimization.
7. Return on Ad Spend (ROAS) vs. Marketing Efficiency Ratio (MER)
ROAS: (Revenue from Ad Campaign) / (Cost of Ad Campaign). A channel-specific metric crucial for paid media optimization.
MER (or Blended ROAS): (Total Revenue) / (Total Marketing Spend). This broader metric accounts for the synergistic effect of all marketing activities (organic, social, email, paid) on overall revenue.
Why they matter in 2025: While ROAS is vital for tuning individual campaigns, MER is critical for strategic budgeting. It prevents “siloed thinking” and acknowledges that a top-funnel brand awareness campaign (with a low immediate ROAS) can make a bottom-funnel retargeting campaign (with a high ROAS) much more effective.
8. Customer Engagement Score (CES)
What it is: A composite metric that assigns a numerical value to a user’s overall engagement level based on multiple actions (e.g., email opens, website visits, content downloads, time spent).
Why it matters in 2025: With the decline of simple engagement metrics like likes, CES uses first-party data to create a predictive measure of lead quality and likelihood to convert. A lead with a high CES is sales-ready; a customer with a high CES is at risk of churn.
9. Net Revenue Retention (NRR)
What it is: Primarily for SaaS and subscription businesses, NRR calculates revenue from existing customers over a period, including upsells and cross-sells, and subtracting downgrades and churn. An NRR over 100% means you’re growing from your existing base even if you acquire zero new customers.
Why it matters in 2025: This metric directly links marketing-led customer success and upsell campaigns to revenue, highlighting the immense value of retention and customer marketing.
Case Study: How a B2B SaaS Company Shifted Its Focus
Problem: “Acme Analytics” (a fictionalized example based on real-world scenarios) was proud of its high blog traffic and social media followers but struggled with stagnant revenue growth. Their reports highlighted vanity metrics, obscuring the real issues.
Action: They implemented a new dashboard focused on:
- CLV:CAC Ratio: Discovered it was a concerning 1.5:1. They were barely profiting from new customers.
- Marketing Influenced Customer Percentage: Found that 85% of new customers had engaged with a specific set of bottom-funnel case studies, which were previously underfunded.
- Customer Engagement Score: Identified that users who watched an “onboarding webinar” within 7 days of signup had a 90% lower churn rate.
Result: They reallocated their budget from top-funnel content aimed at vanity traffic to creating more case studies and automating the webinar invitation process. Within two quarters, their CLV:CAC ratio improved to 4:1, and revenue grew by 35% without increasing the marketing budget.
The Vanity Metrics to Ignore (Or Contextualize Heavily)
These metrics are often easily manipulated, lack context, and rarely correlate to business outcomes. Report on them with extreme caution, if at all.
1. Social Media Likes and Followers
A large follower count means little if that audience doesn’t engage in meaningful ways (e.g., clicks, shares, conversions). A smaller, highly-targeted audience is infinitely more valuable. What to track instead: Engagement Rate (clicks, shares, saves), Referral Traffic from social, and Conversion Rate from social campaigns.
2. Pageviews (Isolated)
High traffic is meaningless if visitors bounce immediately, don’t convert, or are from irrelevant locations. It’s a top-funnel volume metric, not a success metric. What to track instead: Pageviews for key pages, Bounce Rate, Time on Page, and Conversion Rate by Experience.
3. Impressions and Reach
Seeing an ad or post doesn’t equal engagement or memory. A high number here only indicates potential audience size. What to track instead: Click-Through Rate (CTR), which measures the percentage of people impressed enough to take action, and ultimately, Conversion Rate from those clicks.
4. Email Open Rate
With Apple’s Mail Privacy Protection (MPP), open rates are now highly inflated and inaccurate. An “open” no longer guarantees a human saw your subject line. What to track instead: Click-to-Open Rate (CTOR), which measures engagement from those who *actually* open the email, and overall conversion rate from email campaigns.
5. Cost Per Click (CPC)
A low CPC feels efficient, but it’s dangerous if the clicks are from low-quality traffic that never converts. You’re efficiently wasting money. What to track instead: Cost Per Acquisition (CPA) and Return on Ad Spend (ROAS), which measure the cost and return of actual business results.
Implementing Your 2025 Metrics Strategy: A Practical Guide
- Align with Business Objectives: Start with your company’s top-level goals (e.g., increase revenue by 20%, enter a new market). Work backward to identify which marketing metrics directly influence those goals.
- Audit Your Current Dashboard: Ruthlessly remove every metric that doesn’t directly align with those objectives. If you can’t explain how a metric impacts revenue or CLV, it’s a candidate for removal.
- Invest in the Right Tools: Utilize platforms like Google Analytics 4 (focused on event-based tracking), CRM systems (for CLV and attribution), and dedicated attribution platforms to get a holistic view.
- Embrace Multi-Touch Attribution (MTA): Move beyond “last-click” attribution. Use models like time-decay or data-driven (in GA4) to understand how all marketing efforts contribute to a conversion.
- Contextualize Everything: Never report a metric in a vacuum. A 10% conversion rate is bad if your competitors are at 25%. A rising CAC is acceptable if your CLV is rising faster. Always provide context and trend analysis.
- Automate Reporting: Use dashboards to automatically track your key metrics, saving time for analysis and strategy.
Conclusion: Measure for Impact, Not for Ego
The paradigm of digital marketing measurement has permanently shifted. The allure of vanity metrics is fading, replaced by a demanding focus on profitability, customer value, and marketing efficiency. The brands that will thrive in 2025 and beyond are those that wield data not as a shield to justify their existence but as a compass to guide strategic investment and foster genuine customer relationships.
Your action is clear: Audit your dashboard today. Challenge every metric. Ask, “Does this directly help us understand our customers or our financial performance?” If the answer is no, it’s time to let it go. Refocus your energy on the metrics that actually matter—those that tell the true story of your growth and illuminate the path forward.
Frequently Asked Questions (FAQ)
1. With the death of third-party cookies, how can we accurately track attribution?
Accurate tracking requires a shift to a first-party data strategy. This includes leveraging CRM data, encouraging user logins, using consolidated analytics platforms like Google Analytics 4 (which uses modeled data), and implementing privacy-safe server-side tracking. Multi-touch attribution models that use probabilistic and deterministic modeling are becoming essential.
2. Is Google Analytics 4 (GA4) reliable enough to base decisions on?
Yes, but with a key understanding. GA4 uses machine learning to fill in data gaps created by privacy features and ad-blockers (a process called “modeling”). While it may not be 100% accurate in the traditional sense, it provides a consistent and holistic view of user behavior across platforms and devices. The trends and ratios it reveals (like conversion rates and engagement) are highly reliable for decision-making.
3. How often should we review and adjust our key marketing metrics?
Metrics should be reviewed continuously on a dashboard, but a formal review should be conducted quarterly. This review should assess if the metrics are still aligned with business goals, if new metrics are needed, and if any are providing diminishing value. The strategy itself should be agile enough to adjust if a key metric starts trending negatively.
4. What’s the single most important metric for a small business with a limited budget?
For most small businesses, Customer Acquisition Cost (CAC) is the most critical starting point. It directly impacts cash flow. However, the goal is to quickly move toward understanding Customer Lifetime Value (CLV) to ensure the business is sustainable. Initially, focusing on the ROI of specific, tightly-targeted campaigns can provide immediate clarity.
5. How do you measure the ROI of brand awareness campaigns, which don’t directly drive conversions?
Brand awareness is a long-game investment. Measure its impact through indirect but meaningful metrics:
- Direct Traffic: An increase in people typing your URL directly into their browser.
- Branded Search Volume: A rise in searches for your company name (tracked in Google Search Console).
- Social Sentiment Analysis: Measuring the tone and volume of mentions.
- Survey Data: Periodically measuring aided and unaided brand recall.
- Lower CPCs: Higher brand awareness often leads to higher Quality Scores in paid search, lowering your cost per click.
The ultimate measure is its influence on the Marketing Influenced Customer Percentage and the blended Marketing Efficiency Ratio (MER).


